
-
MetaTrader 4 Brokers
The top MT4 brokers in AU
-
MetaTrader 5 Brokers
The best MT5 brokers in AU
-
TradingView Brokers
The best TradingView brokers
-
cTrader Brokers
The top cTrader brokers in AU
-
Forex Trading Apps
Trade on the go from your phone
-
Copytrading Brokers
Copy professional traders
-
All Trading Platforms
Find a platform that works for you


Last Updated On April 26, 2023

Support and resistance trading is at the core of technical analysis and trading from chart data. Support and resistance levels are points at which a Forex market trend is likely to stop, and may reverse. In support and resistance trading, traders try to predict these points, called pivot points and connect them with a line to create a support or resistance level. By drawing these levels on charts, traders are able to make assumptions about the future movement on the currency pairs.
How to Draw Support and Resistance Lines
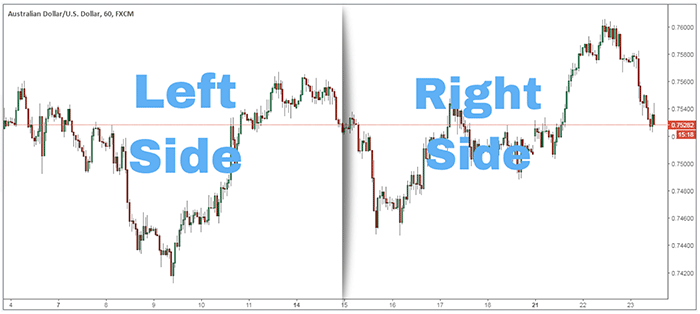
Before drawing your own support and resistance levels, you need to learn the right way to draw them. A common mistake is drawing support and resistance levels from the left side of the card and the level should always be drawn from the right-hand side of your charts. This is because the current data on the right of the chart is more important than the historical data on the left of the chart. The most recent price action better reflects the current supply and demand.
Always start on the right side and then work your way back.
Use Zones, Not Lines
Use support and resistance zones instead of support and resistance lines. Price is a very dynamic concept and volatility changes constantly, making it difficult to make a trading decision based on individual lines. By using zones, you will have a much better frame of reference from which to make trading decisions.
How to Trade with Support and Resistance Zones
The most common way to trade support and resistance is to buy at the support level and to sell at the resistance level. However, by the time you’ve identified the support and resistance levels, they will have already been tested multiple times, and the more a level is tested, the weaker it becomes.
As such, to increase the effectiveness of support and resistance trading, we need to implement new tactics. I often use an unorthodox approach to using support and resistance levels, which is based on using other traders stop losses.
Support and resistance levels are not only used as market entry points, but they are also frequently used by retail traders as a place to put their protective stop losses.
Larger traders often use this information and target those stop losses that reside above resistance or below the support level. Once a support or resistance level is broken, there are only two things that could happen:
- The price continues to move in the direction of the breakout or
- The price reverses and moves in the opposite direction.
Trading Strategies
Now that we know how the price behaves around support and resistance, we can use this knowledge to our advantage and develop a trading strategy.
The best approach is often to “fade” (to trade against the trend) the support and resistance breakout. For this trading approach to work, you need to select the “right” support or resistance level carefully. So, start from the right side of the chart with the most recent swing/pivot points and move your way to the left. If you manage to connect at least two points of references you can move to the next step.
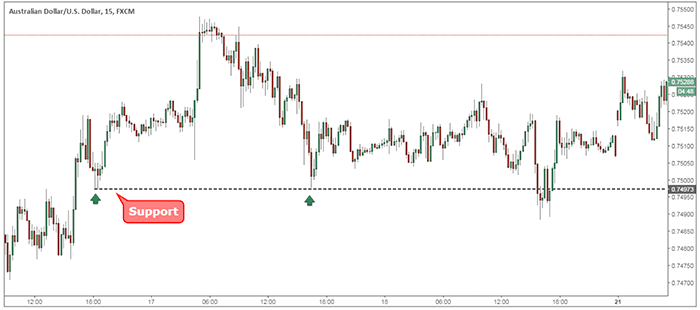
The second step is to wait for that level to get broken. If the breakout happens around the London open or the New York open, then the pattern becomes even more reliable.
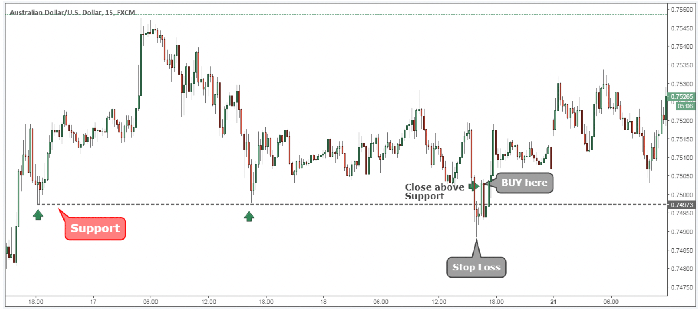
The entry strategy for this breakout and the reverse pattern is quite simple. If we’re trading off of a support level, we buy once we close back above the broken support. Typically, you would like to see a strong close above the support level. The ideal place to hide your protective stop loss is below the swing low that resulted from the breakout.
This trading strategy will ensure that even if you’re stopped out, you will only lose a minimal amount of your investment compared with the potential profits available to be made.
Share your knowledge


Stay updated
This form has double opt in enabled. You will need to confirm your email address before being added to the list.