
-
MetaTrader 4 Brokers
The top MT4 brokers in AU
-
MetaTrader 5 Brokers
The best MT5 brokers in AU
-
TradingView Brokers
The best TradingView brokers
-
cTrader Brokers
The top cTrader brokers in AU
-
Forex Trading Apps
Trade on the go from your phone
-
Copytrading Brokers
Copy professional traders
-
All Trading Platforms
Find a platform that works for you


Last Updated On February 23, 2023

The Head and Shoulder (H&S) pattern signals the possibility that the prevailing trend may end, and a new trend in the opposite direction might start. The H&S pattern is a bearish reversal pattern that appears at the end of an uptrend, but there is also an inverted version of the H&S pattern that develops at the end of a downtrend called an inverted H&S pattern.
From a risk management perspective, not that reversal patterns spotted on the daily or weekly chart can take more time to develop. Also good to know is that all reversal patterns present a higher risk because as a rule, a trend in motion tends to continue. However, the Head and Shoulder pattern can be very reliable when traded correctly.
In the first part of this step-by-step guide, I will cover what you should be looking for when it comes to a head and shoulder pattern, the signals that give it confirm it, and how we trade this pattern for profit.
How to Recognize Head and Shoulder Patterns
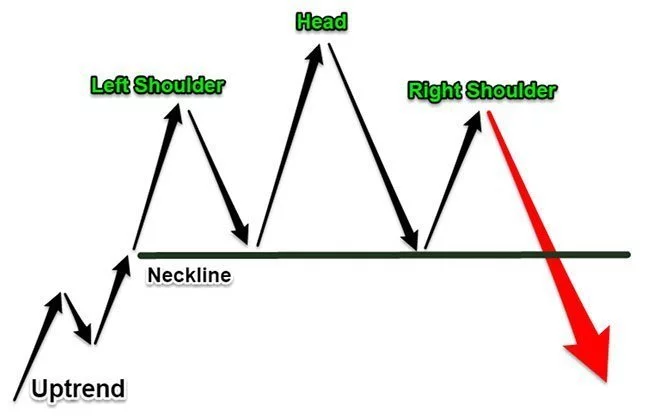
The standard Head and Shoulder pattern consists of four major components.
- The first element of the H&S pattern is the left shoulder, which follows a pre-existing uptrend – then we look for a retracement that’s going to create our left shoulder.
- The next element is the Head coming from the starting point of our neckline which then goes beyond the left shoulder, followed by a retest of the starting point of that neckline.
- The third element is the right shoulder, which is a failed attempt to break into new highs and results in a reversal of the uptrend. More often, the right shoulder ends near the vicinity of the left shoulder.
- Lastly, the neckline is the support level that connects the low swing points below the shoulders.
If the Head and Shoulder pattern is something you want to incorporate into your own trading, then you need to train your eyes to spot the shape you see in the image below:
As a word of caution, if you are going to take advantage of this pattern in real time, you need to be able to identify the Head and Shoulders very quickly and very easily.
Moving forward, let’s focus our attention on how to enter, place your stop and place the profit target for the Head and Shoulder pattern.
Strategy to trade Head and Shoulder Patterns
Now that we know what we’re looking for in the market, we can start looking at how we can place trades using this reversal pattern. The textbook strategy to trade the Head and Shoulder pattern is to wait for a break and close below the neckline. The H&S pattern is only confirmed once the neckline is broken.
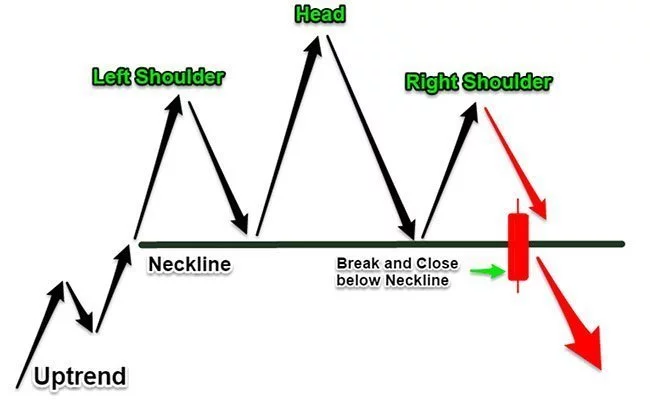
A more aggressive approach that I sometimes use to trade the Head and Shoulder pattern is to enter at the right shoulder. You can use the left shoulder to anticipate the approximate level where the right shoulder would form. You can do this by simply placing a sell limit order directly at the left shoulder.
There are a couple of different options you have at your disposal when it comes to this stop loss strategy. The standard strategy is to hide your protective stop loss above the Head. Alternatively, you can place your stop loss above the right shoulder and add a buffer for market noise. The advantage with the second strategy is that you can minimize the potential loss.
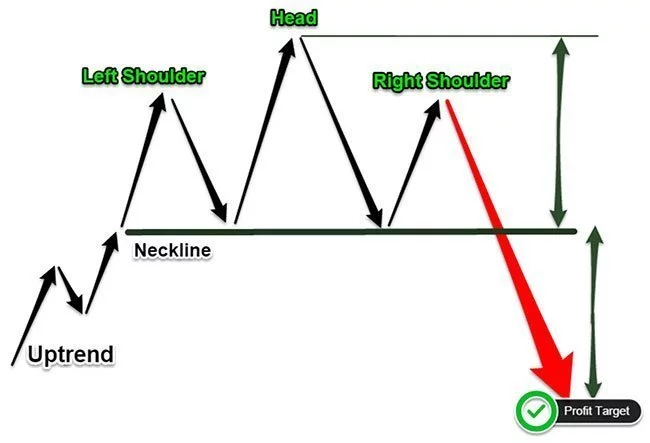
The standard take profit strategy consists of two steps. First, we have to measure the price distance between the Head and the neckline and then project the same price distance to the downside starting from the neckline. The advantage of this strategy is that you use market dynamic forces rather than random price levels.
Let’s now look through some real chart examples of the Head and Shoulder pattern.
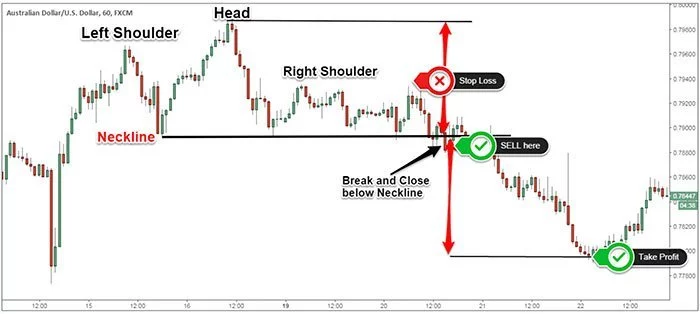
Head and Shoulder Real Trading Examples
On the AUD/USD chart below, we have a really good example of a Head and Shoulder pattern spotted on the 1H chart. When the right shoulder fails to reach the left shoulder, the only entry strategy we can implement is to wait for a break and close below the neckline.
In the example below, I’ve broken down an example of the inverted head and shoulder pattern which appears at the end of a downtrend.
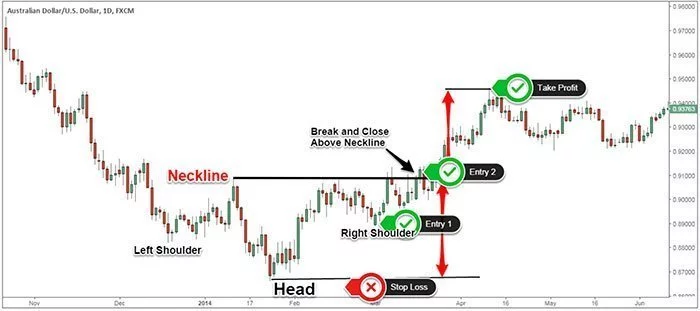
Conclusion
You can be quite creative when trading the Head and Shoulder pattern because you have several options to work with. Like all charting patterns, the head and shoulder price structure highlights the supply and demand imbalances in the market and shows a clear change in market sentiment.
Share your knowledge


Stay updated
This form has double opt in enabled. You will need to confirm your email address before being added to the list.