
-
MetaTrader 4 Brokers
The top MT4 brokers in AU
-
MetaTrader 5 Brokers
The best MT5 brokers in AU
-
TradingView Brokers
The best TradingView brokers
-
cTrader Brokers
The top cTrader brokers in AU
-
Forex Trading Apps
Trade on the go from your phone
-
Copytrading Brokers
Copy professional traders
-
All Trading Platforms
Find a platform that works for you


Last Updated On February 23, 2023

Rising and falling wedge chart patterns are classic chart patterns that can be found either at the end of the trend and usually signal market exhaustion or trend continuation. The market tends to form these patterns over and over again. Regardless of the environment where you see the wedge pattern, the price structure will remain the same; the only difference is the location within the trend.
In the study of technical analysis, there are two types of wedges:
- Rising or ascending wedge
- Falling or descending wedge
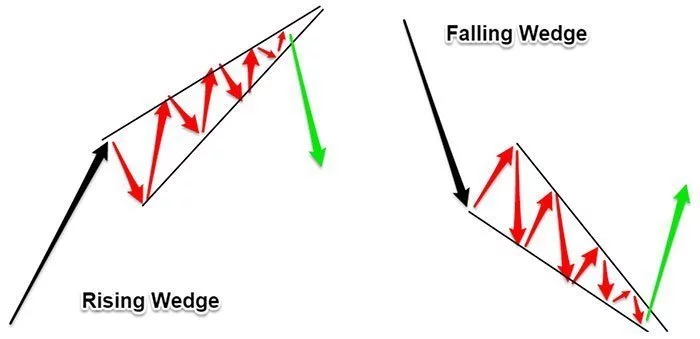
The above image highlights the rising wedge and falling wedge when they act as a reversal chart pattern. However, the wedge pattern can also serve as a continuation pattern in which case it looks similar to the one in the figure below:
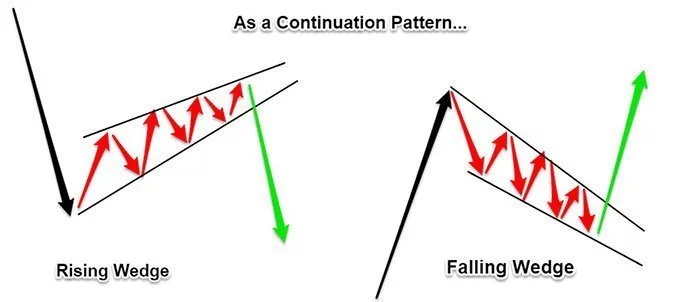
The wedge pattern has an identical price structure as the symmetrical triangle; however, the difference comes from the fact that the support and resistance lines rise or fall depending on the wedge pattern type.
In the first part of this trading guide, we will show you how to identify the wedge chart pattern in real time. Then we will go over a straightforward trading strategy to take advantage of the reversal price structure.
How to Recognize Rising Wedge Pattern
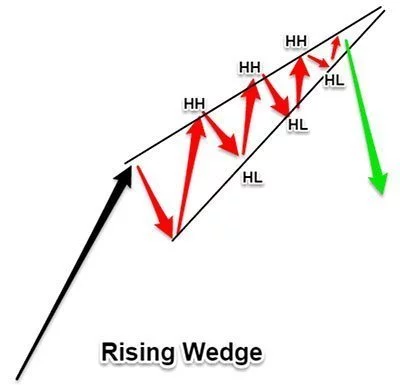
The ascending wedge pattern is composed of a series of higher highs followed by a series of higher lows. The lower highs series can be connected using a resistance line sloping upwards. The second element of the rising wedge is a series of higher lows that can be connected using a support line sloping upwards. The support line is steeper than the resistance line.
Another characteristic of the rising wedge is that with each successive new high, there should be a loss in the bullish momentum and subsequently signalling the bullish trend is becoming weaker.
If the rising wedge pattern is something you want to incorporate into your trading, then you need to train your eyes to spot the shape you see in the image below:
Moving forward, let’s look at how to enter the trade, place your stop and place the target for the rising wedge pattern.
Trade Rising Wedge Pattern Strategy
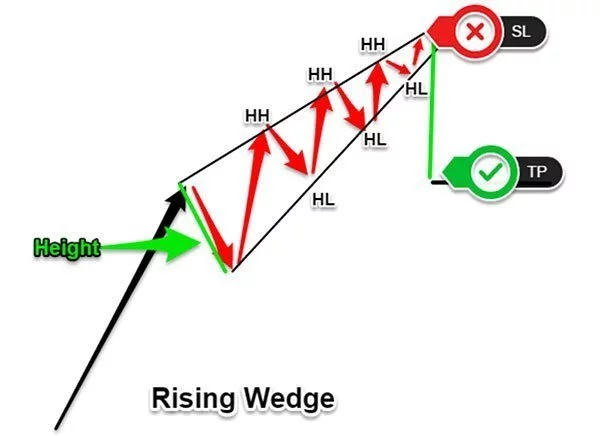
Now that we know what we’re looking for in the market, we can start looking at how we can place trades using the rising wedge pattern. The textbook strategy to trade the rising wedge pattern is to wait for a break and close below the support line sloping upwards.
Once the breakout has occurred, typically the price should never look back. The strategy holds both for the rising wedge as it does to the falling wedge.
The price target of this price formation should be the height of the wedge projected down from the breakout point. The stop loss placement for the rising wedge pattern is above the highest high point on the chart. You can also add a buffer to neutralise the short-term market noise.
Let’s now look through some real chart examples of the rising wedge pattern.
Trading Examples
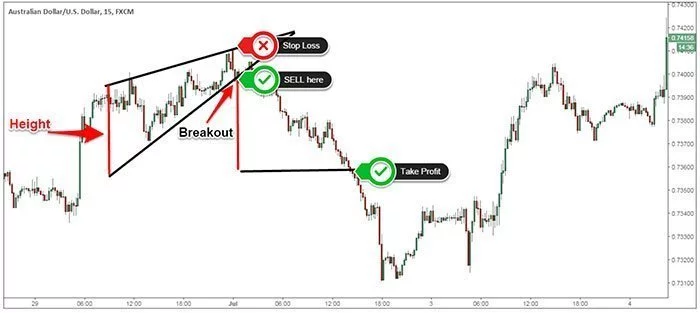
The visual representation of a real rising wedge pattern is in the figure below which is a typical example of a rising wedge pattern that is found at the end of the trend and which signals a trend reversal.
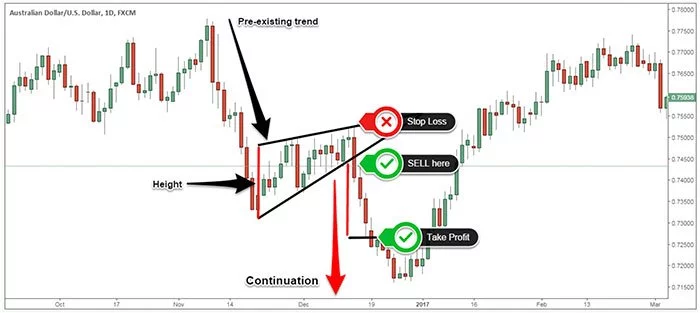
Alternatively, the rising wedge pattern can also be found in a downtrend, and it acts as a continuation pattern. In this case, we’re looking to take the breakout in the direction of the pre-existing trend.
Conclusion
In technical analysis, the rising and falling wedge are versatile chart patterns that can be used both as a continuation and reversal. They often come in all sizes and shape, and they signal that there is an intense battle between the bulls and the bears. The breakout direction will indicate who the winner is, and where we stand regarding the supply and demand equation.
Share your knowledge


Stay updated
This form has double opt in enabled. You will need to confirm your email address before being added to the list.