
-
MetaTrader 4 Brokers
The top MT4 brokers in AU
-
MetaTrader 5 Brokers
The best MT5 brokers in AU
-
TradingView Brokers
The best TradingView brokers
-
cTrader Brokers
The top cTrader brokers in AU
-
Forex Trading Apps
Trade on the go from your phone
-
Copytrading Brokers
Copy professional traders
-
All Trading Platforms
Find a platform that works for you


Last Updated On February 23, 2023

In this section, we’re going to study one of the most straightforward continuation patterns that develop in the middle of a robust trading market. The flag price formation is similar to the wedge chart pattern, but the lines that encapsulate the flag structure don’t converge, but the support and resistance levels are parallel. The second significant difference is that the flag pattern develops within a shorter period.
In the study of technical analysis, there are two types of flags:
- Bullish Flags
- Bearish Flags
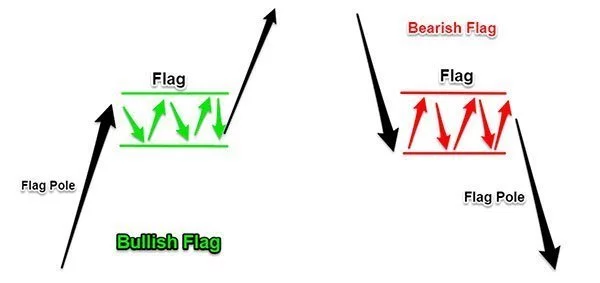
While most of the focus in this guide will be on bullish flags, remember that the strategy applies to bearish flags – just opposite. I have chosen to cover the flags in this way to prevent redundancy and promote brevity. Once the reader understands bullish flags, the bearish flags should come naturally.
The flag price structure unfolds in all markets, in all time frames and above all, they show up on your chart a lot. Once you learn how to identify the bullish and bearish flags and understand their characteristics, it will become easier to trade them.
In the first part of this trading guide, we will focus on how to identify the bullish flag pattern in real time, and then move on to cover a straightforward trading strategy to capture the bullish trend.
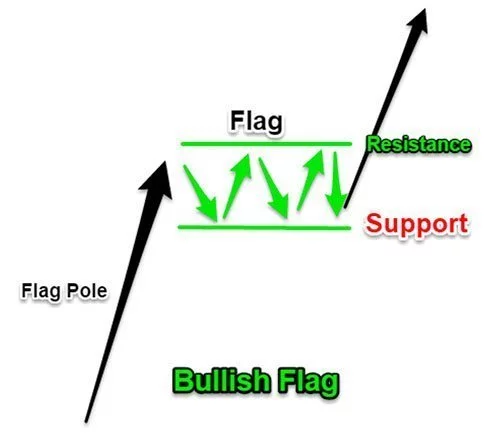
How to Recognize the Bullish Flag Pattern
The bullish flag pattern is formed by two distinctive elements. The first element of the flag pattern is a pre-existing trend. In the case of the bullish flag, we’re talking about an uptrend. The second element is the flag attached to the pole. Or in other words, the horizontal pause in the trend where the market moves in a very narrow trading range between a support and resistance level. The main characteristic of the flag is that the resistance and support levels are parallel.
The most important part of the flag pattern is the prevailing trend which is key to many chart pattern success rates. The easiest way to remember this rule is to remember that every flag has a pole.
If the bullish flag pattern is something you want to incorporate into your trading, then you need to train your eyes to spot the shape. It looks something like the image below:
The next step is how to enter, place your stop and place the target for the rising wedge pattern.
Strategy to trade Bullish Flag Patterns
The textbook strategy to trade the bullish flag pattern is to wait for a break and close above the resistance line. It’s important to see the market breaking above the resistance line with strong momentum; otherwise, the flag pattern may be part of a different and a larger price structure.
For the take profit (TP) strategy, we get to use part of the price structure of the flag, namely the pole or the prevailing trend. Only measure the price length of the pole and project the same price distance up from the breakout point.
A visual image of the bullish flag and where to place the TP can be seen below:
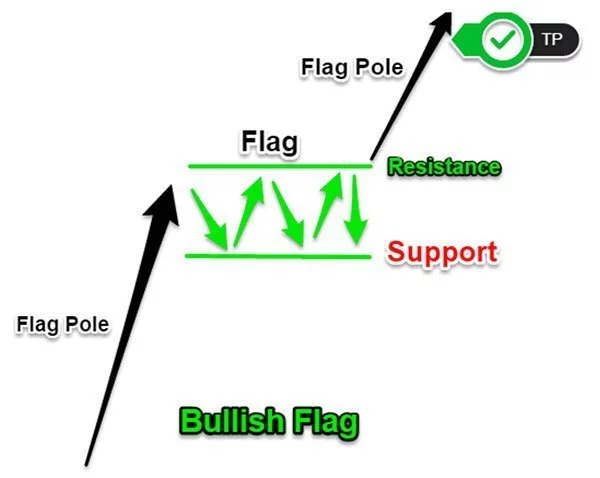
One of the main advantages of trading flag patterns is the opportunity to use a very tight stop loss. The protective stop loss placement is below the support line. You should also add a buffer to cancel out some of the short-term market noise.
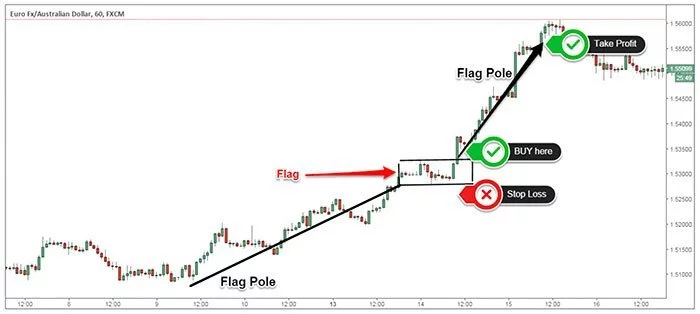
Let’s now look through some real chart examples of the bullish and bearish flag patterns.
Bullish & Bearish Flag Real Trading Examples
On the EUR/AUD chart below, we have an excellent example of a bullish flag pattern spotted on the 1H chart. The subsequent breakout of the flag has led to a strong up move, which is of the same price magnitude as the flagpole.
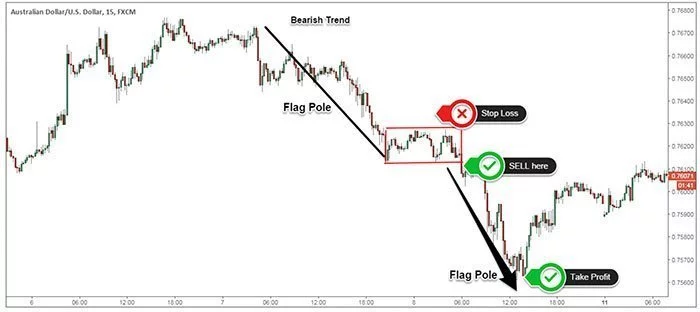
In the example below, we’ve highlighted the bearish flag pattern which appears in the middle of a downtrend.
Conclusion
When trading the flag chart pattern, the level of volatility will decrease, and the price will compress until the prevailing trend is ready to resume again. You should view the flag price formation simply as a pause in the trend. You also need to be aware that flags tend to develop a lot quicker than other chart patterns, so you need to be able to act immediately. Otherwise, you risk losing the opportunity to catch the trend.
Share your knowledge


Stay updated
This form has double opt in enabled. You will need to confirm your email address before being added to the list.