
-
MetaTrader 4 Brokers
The top MT4 brokers in AU
-
MetaTrader 5 Brokers
The best MT5 brokers in AU
-
TradingView Brokers
The best TradingView brokers
-
cTrader Brokers
The top cTrader brokers in AU
-
Forex Trading Apps
Trade on the go from your phone
-
Copytrading Brokers
Copy professional traders
-
All Trading Platforms
Find a platform that works for you


Last Updated On February 23, 2023

One of the most popular continuation patterns called the symmetrical triangle pattern. A continuation pattern is a standard technique that will allow you to enter into a trending market if you’ve missed the starting point of a new trend. The continuation pattern is traded in the direction of the prevailing trend.
When trading a continuation pattern, you need to have a pre-existing trend to ensure you avoid sideways ranging markets. If you see a symmetrical triangle chart pattern when there’s no clear market direction, ignore it completely.
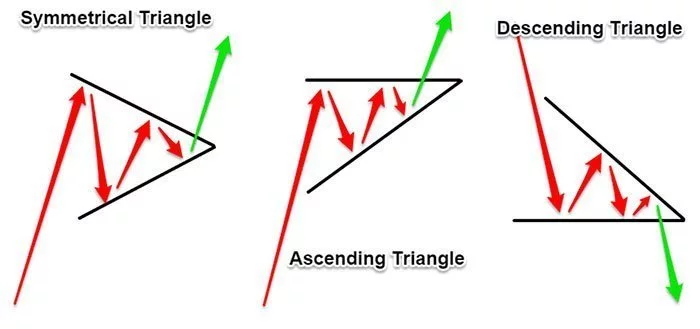
In the study of technical analysis, there are three types of triangles:
- Symmetrical Triangles
- Ascending Triangles
- Descending Triangles
In the first part of this deep-dive, I want to show you how to identify the symmetrical triangle chart pattern in real time and then, before we look at a simple trading strategy to take advantage of this continuation pattern.
How to Recognize the Symmetrical Triangle Pattern
After the market has been trading actively in a single direction, it moves sideways as if to catch its breath. During this time of consolidation, symmetrical triangle patterns will often emerge.
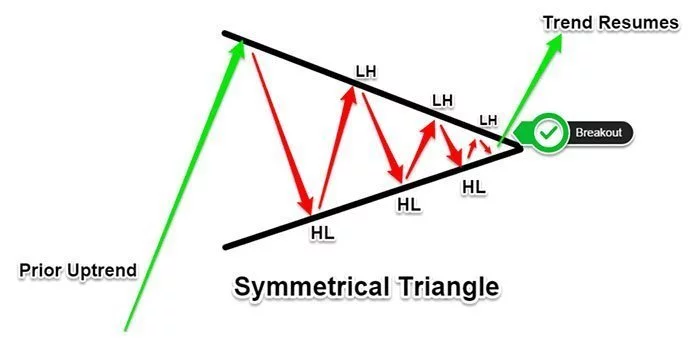
- The first element of the symmetrical triangle is an ongoing trend, with either bullish or bearish bias. So watch for these patterns in markets that are trending.
- The second element of the symmetrical triangle is a series of lower highs that can be connected using a resistance line sloping downwards.
- The third element of the symmetrical triangle is a series of higher lows that can be connected using a sloping upwards support line. At some point the resistance and support line should converge, making a breakout inevitable.
You need to train your eye to spot the symmetrical triangle pattern.
Next, we should look at how to trade the trend continuation setup, place your stop and place the target for the symmetrical triangle pattern.
Strategy to trade Symmetrical Triangle Pattern
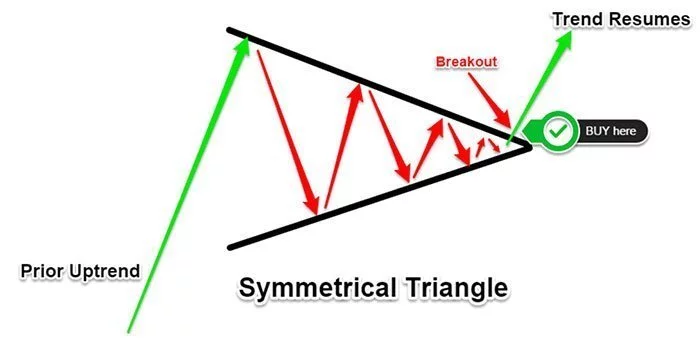
The textbook strategy is to wait for a break and close below the resistance line sloping downwards. The market momentum should align with the market direction, so when the price breaks above the sloping downwards resistance line, the following move is very explosive and fast moving.
The breakout can also happen in the opposite direction of the prevailing trend, but for a higher success rate, I only trade the breakout in the direction of the prevailing trend.
The profit target for this price formation is the height of the triangle measured in the direction the breakout from the breakout point. The height of the triangle can be measured using the highest and lowest point of the symmetrical triangle.
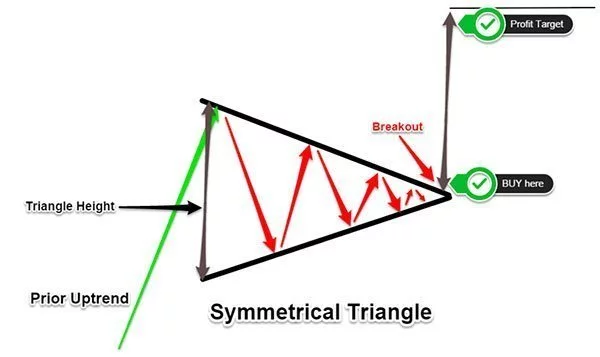
The stop loss placement for the symmetrical triangle will be whatever your risk level is underneath the support line sloping upwards. The price structure of the triangle gives us a decent spot to hide our protective stop loss. You can also add a buffer to cancel out the short-term market noise.
Here are some real chart examples of the symmetrical triangle pattern to illustrate the above points in a real market environment.
Symmetrical Triangle Pattern Real Trading Examples
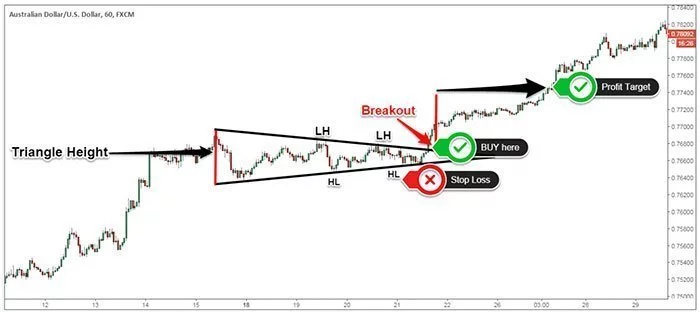
In the chart example below, the price is making a series of higher lows, and lower highs as the price is consolidating. This pattern creates a perfect example of a bullish symmetrical triangle, which leads to the continuation of the previous bullish trend.
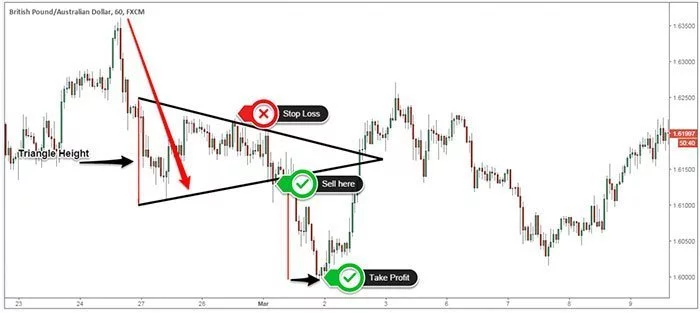
An example of the bearish symmetrical triangle pattern can be seen in the figure below. The only difference is that the pre-existing trend is down.
 Conclusion
 Conclusion
The direction of the prevailing trend defines the shape of the symmetrical triangle. If we have a preexisting bullish trend, the symmetrical triangle can potentially lead to a continuation of the bullish trend. The most important characteristic of the symmetrical triangle is the prevailing trend. The stronger the preexisting trend is, the more reliable the symmetrical triangle will be.
Share your knowledge


Stay updated
This form has double opt in enabled. You will need to confirm your email address before being added to the list.